AvoData
Data-Driven Magazine Editorial
Skills
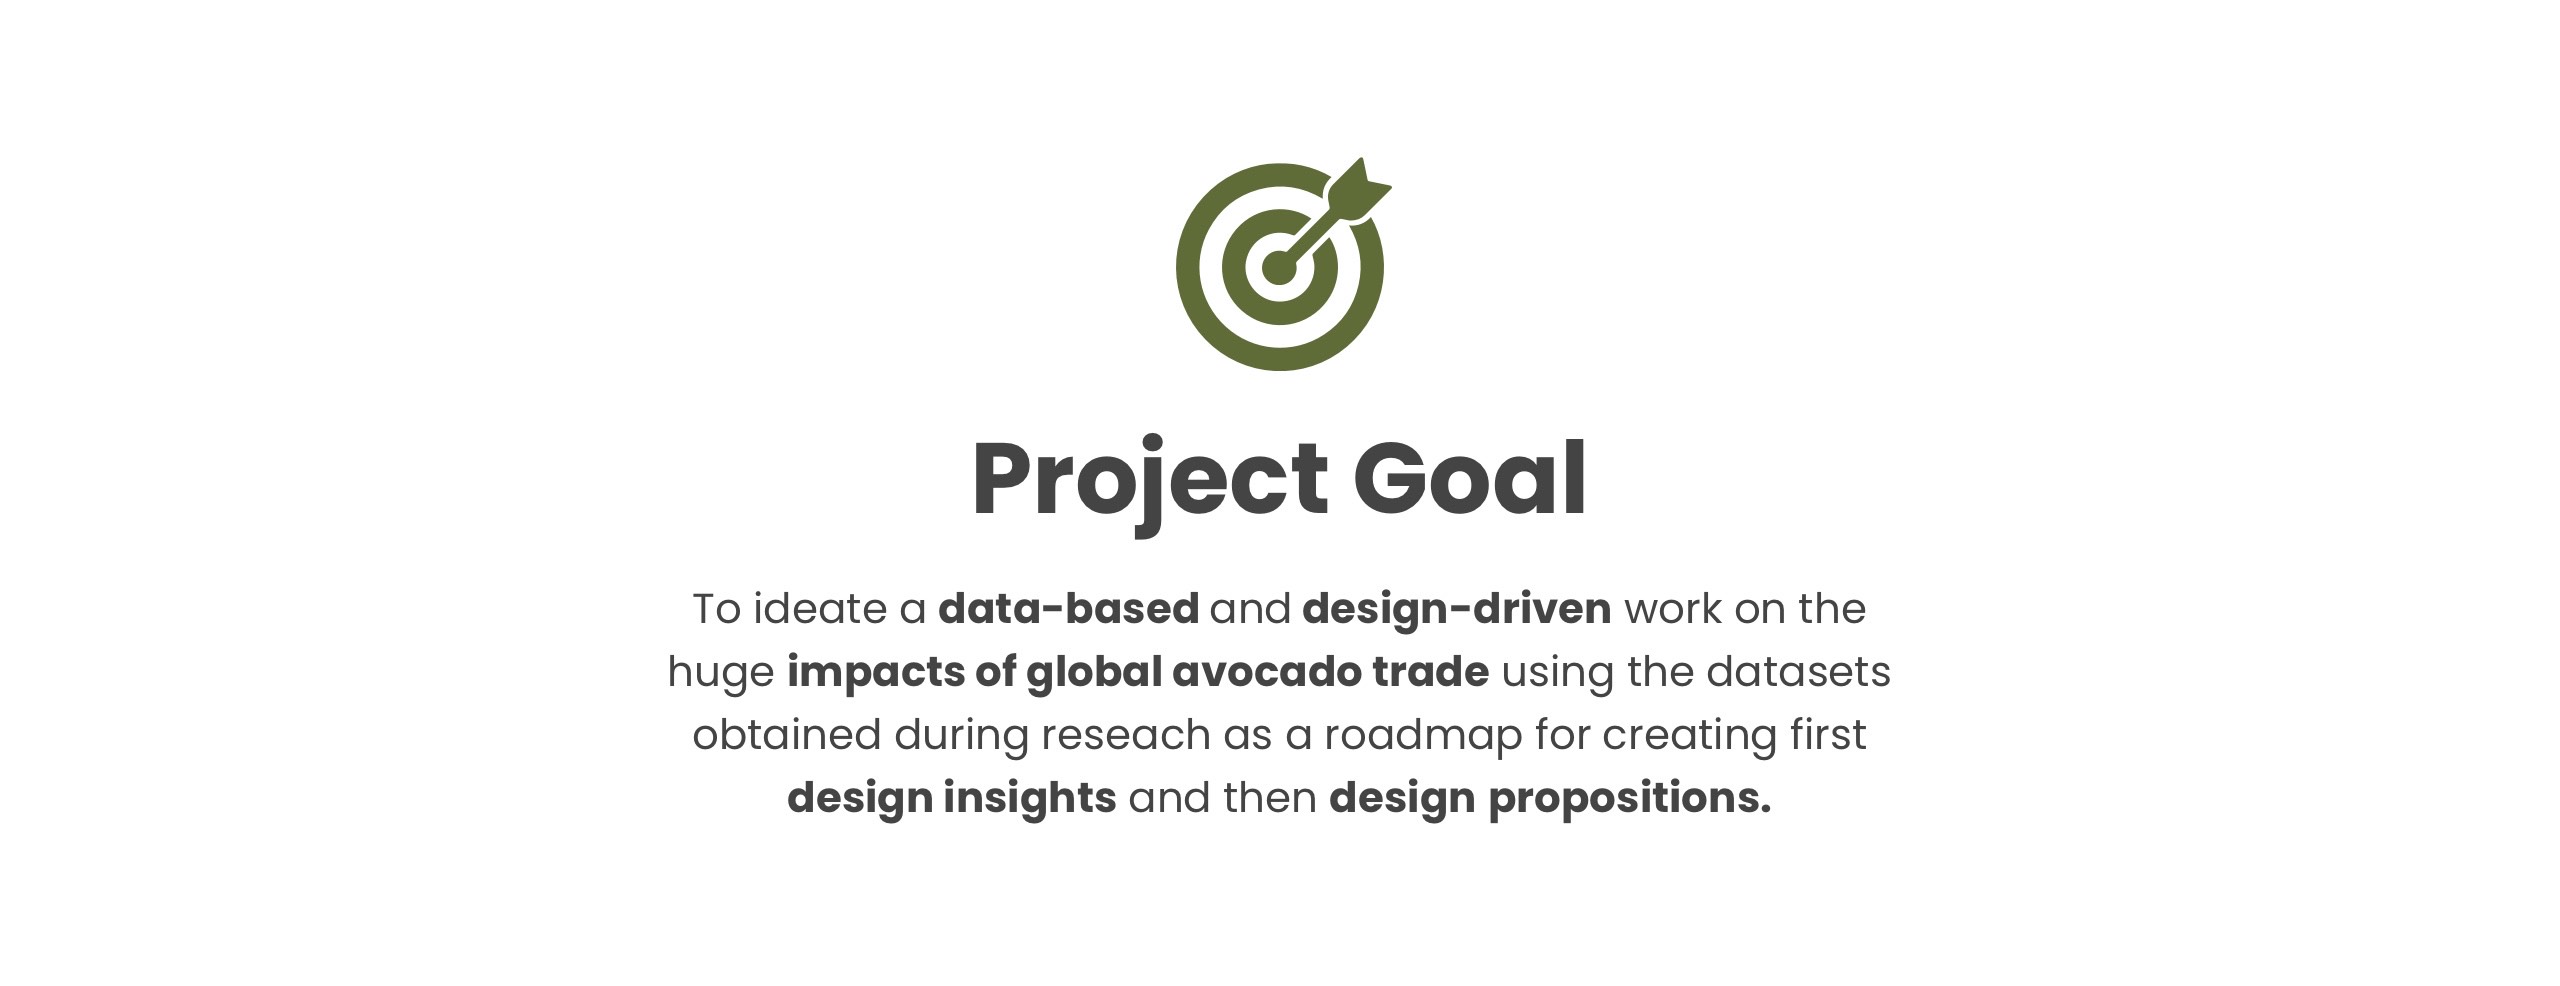
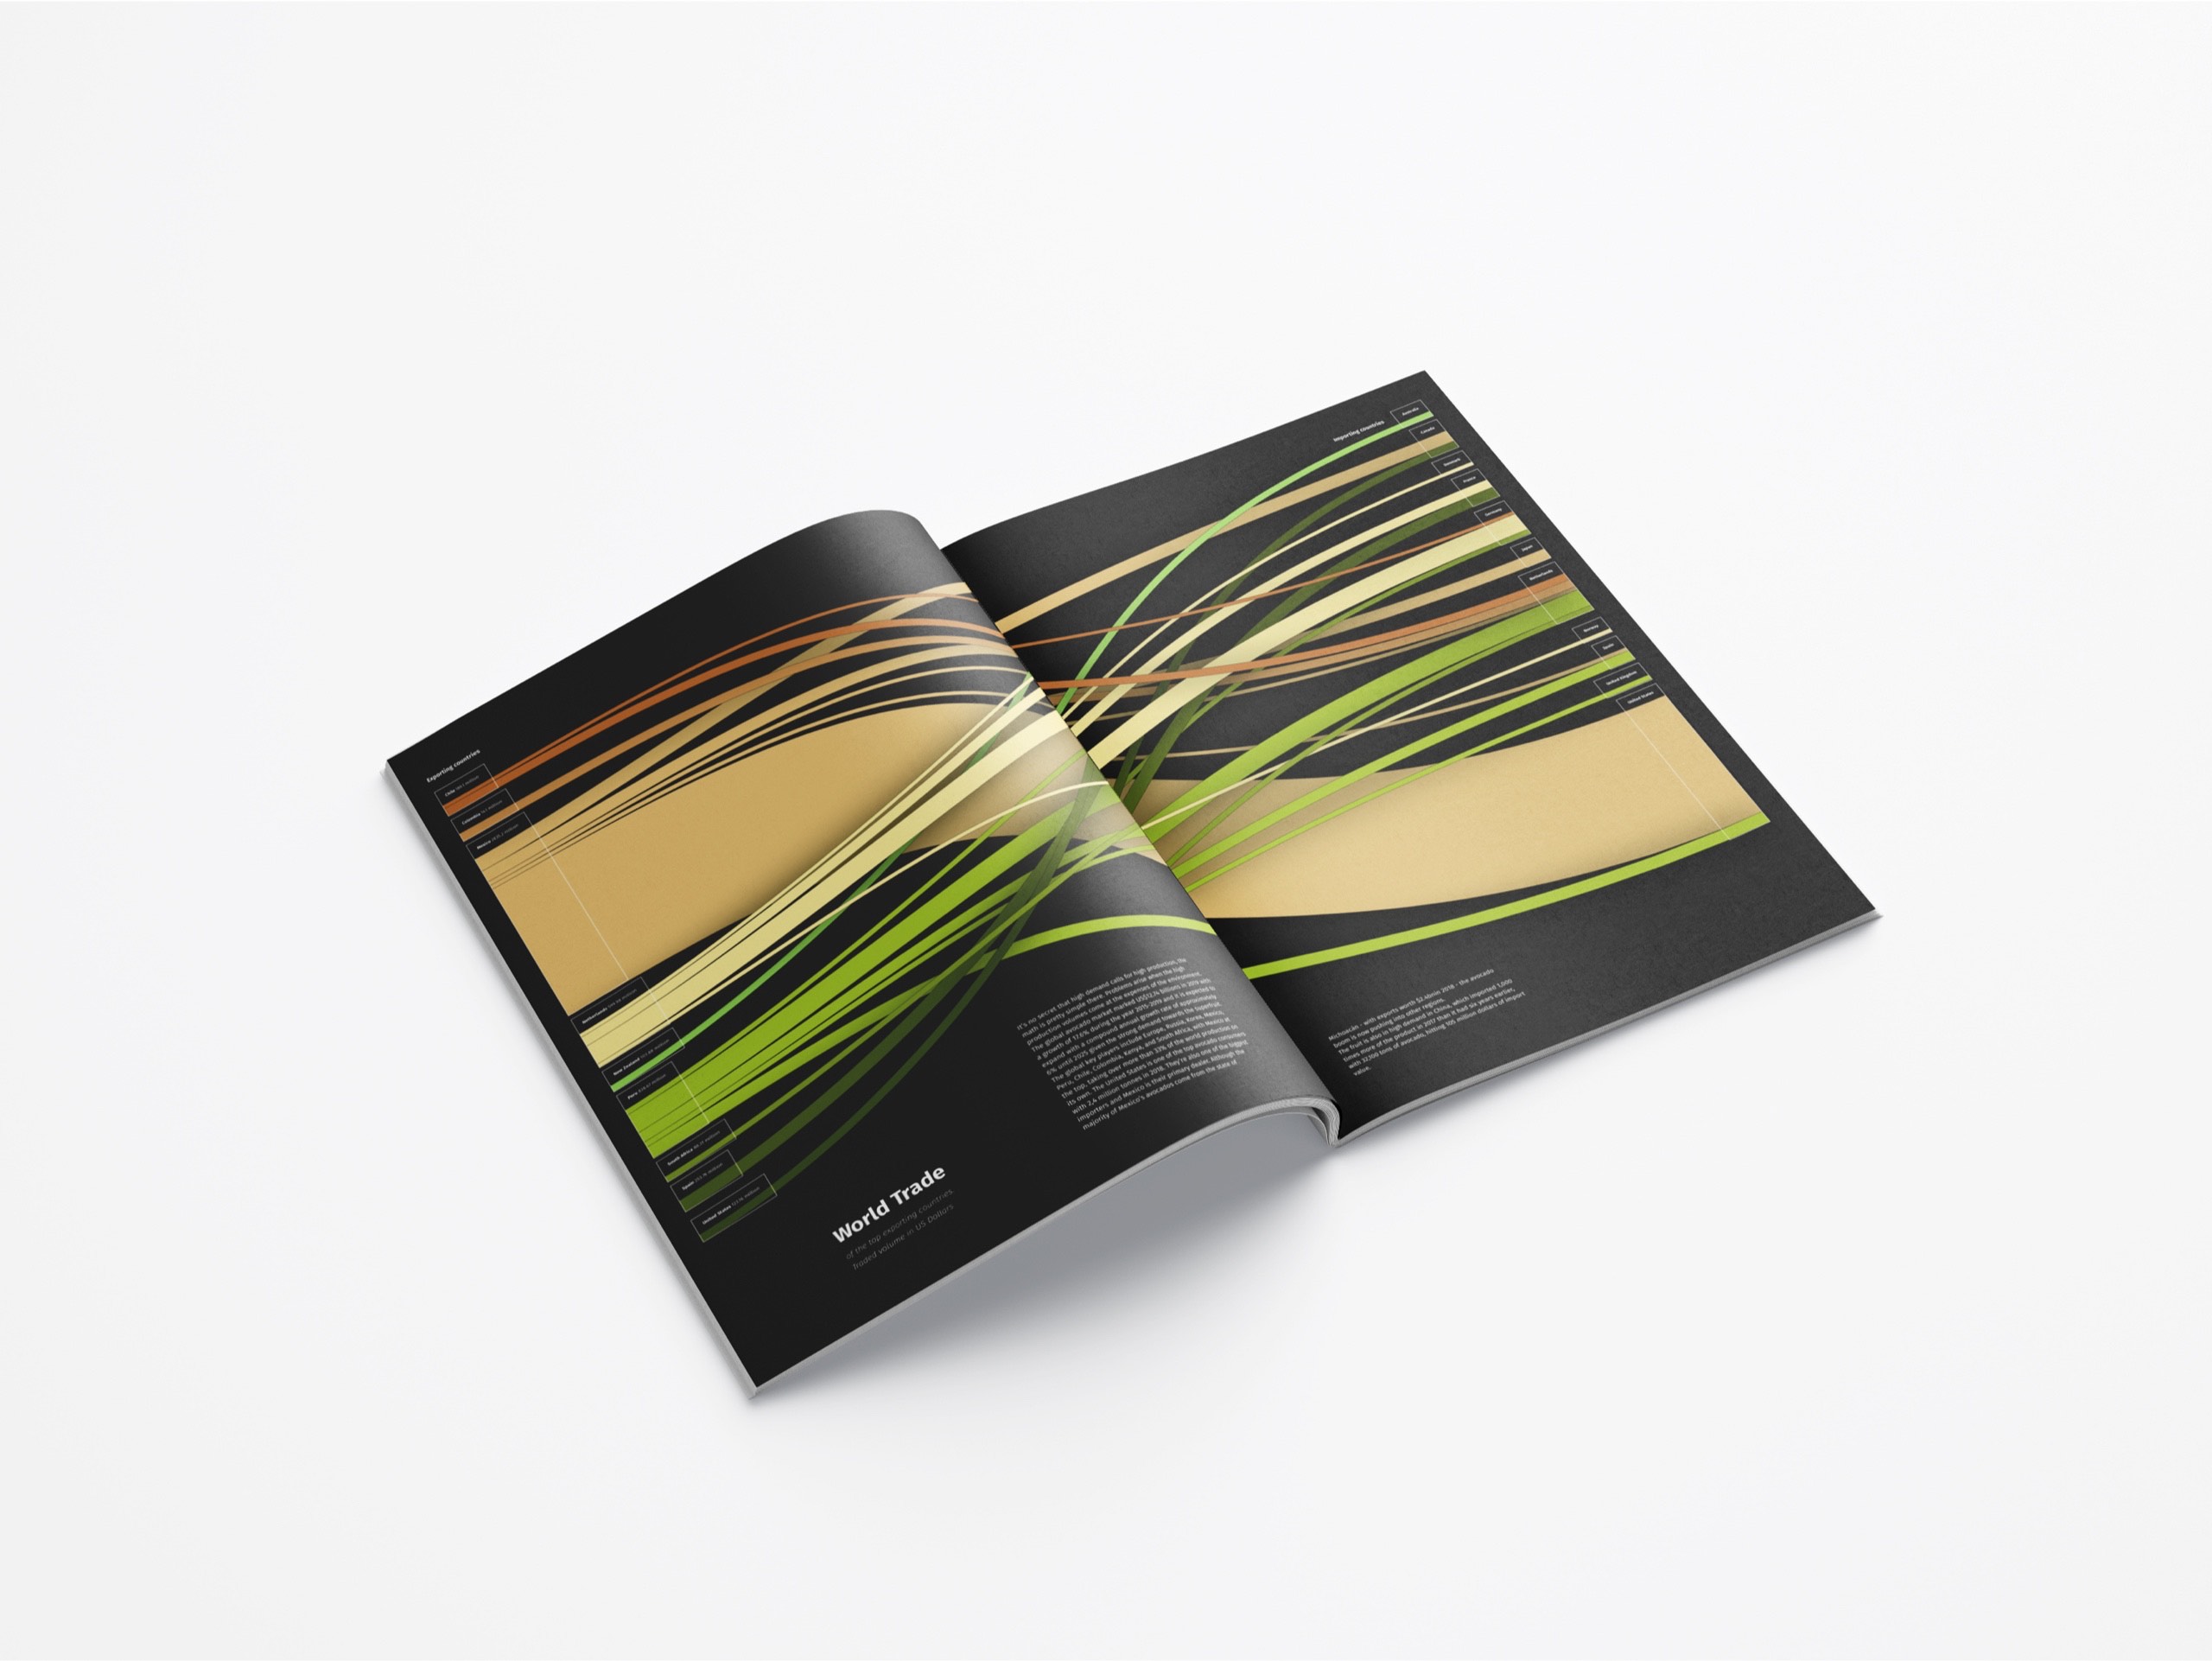
The research focused on the global avocado trade and brought the team to develop a magazine editorial to shed the light on the huge environmental impacts of this phenomenon and how its volumes of trade around the world are negatively impacting and modifying ecosystems globally.


A team journey
through data
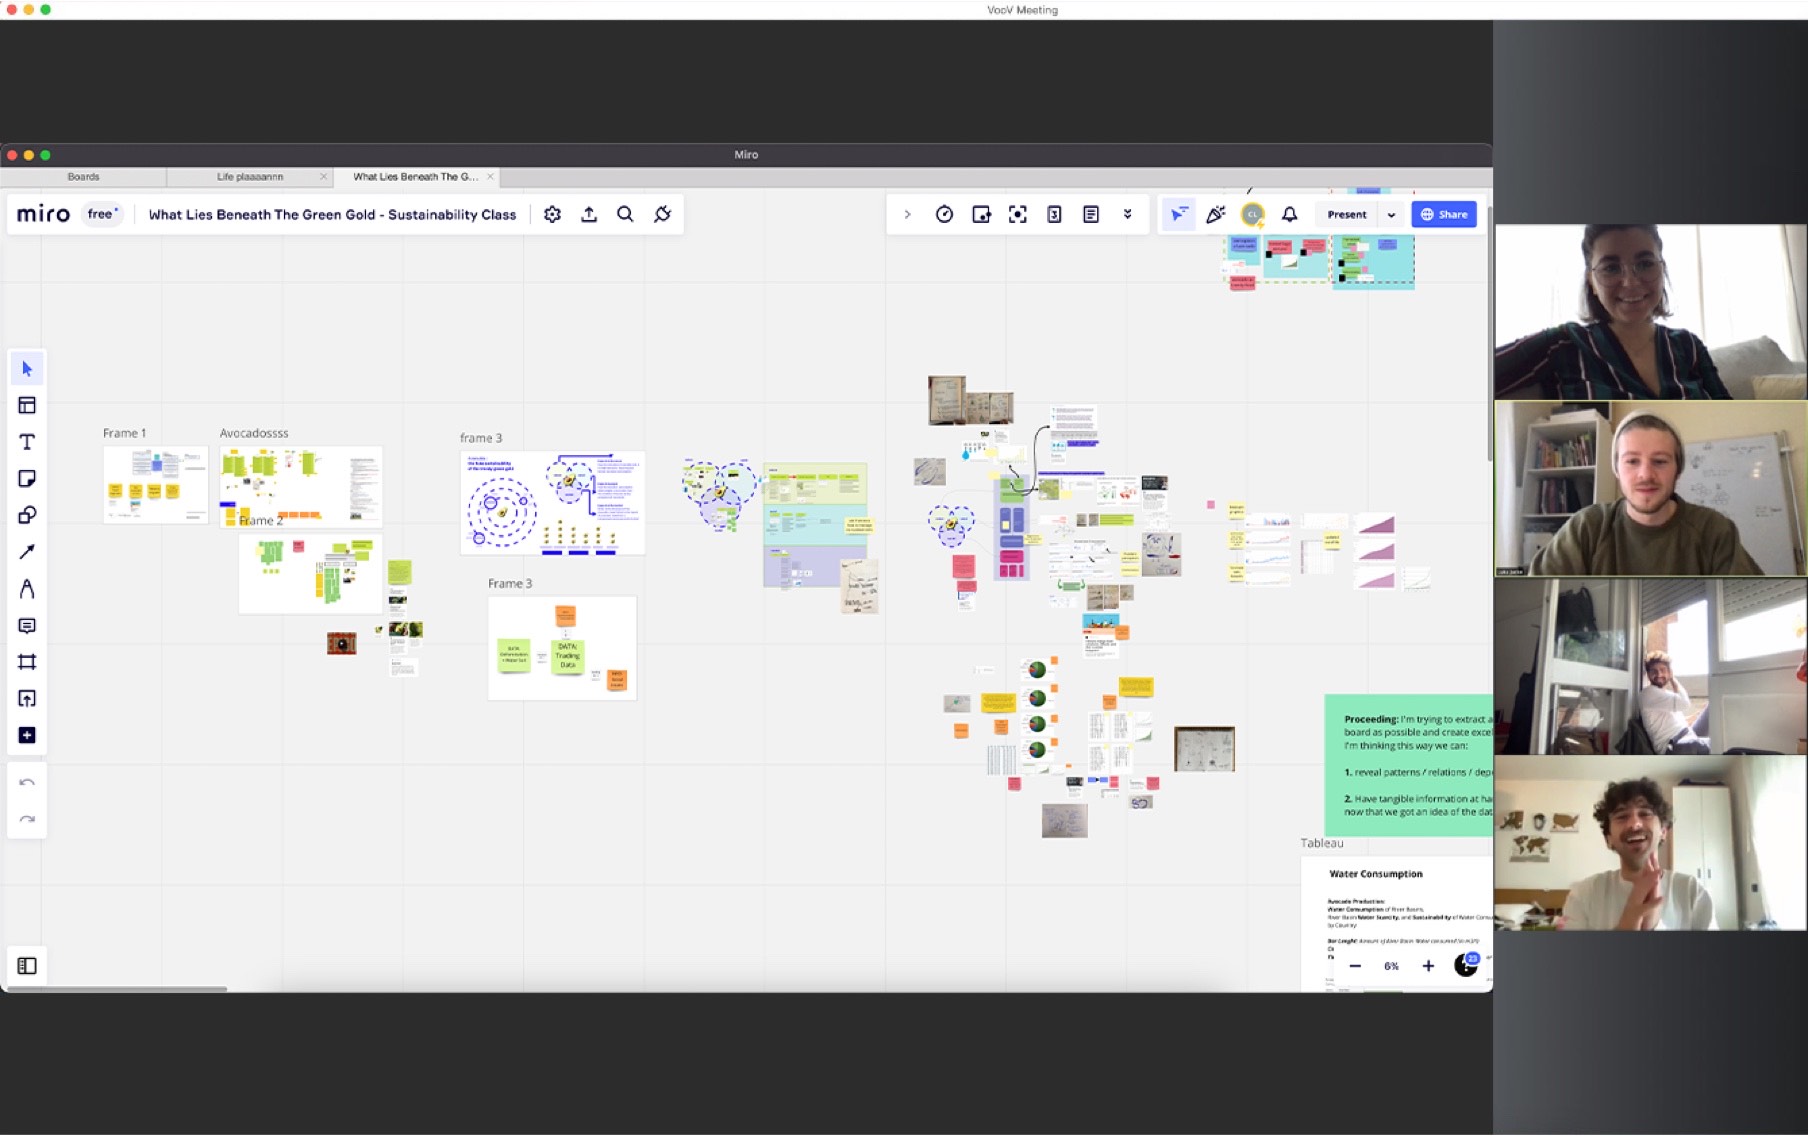
The work was completed remotely by an international team comprised of different professional profiles such as product, interaction, digital, and service designers.
Explore and Hypothesize
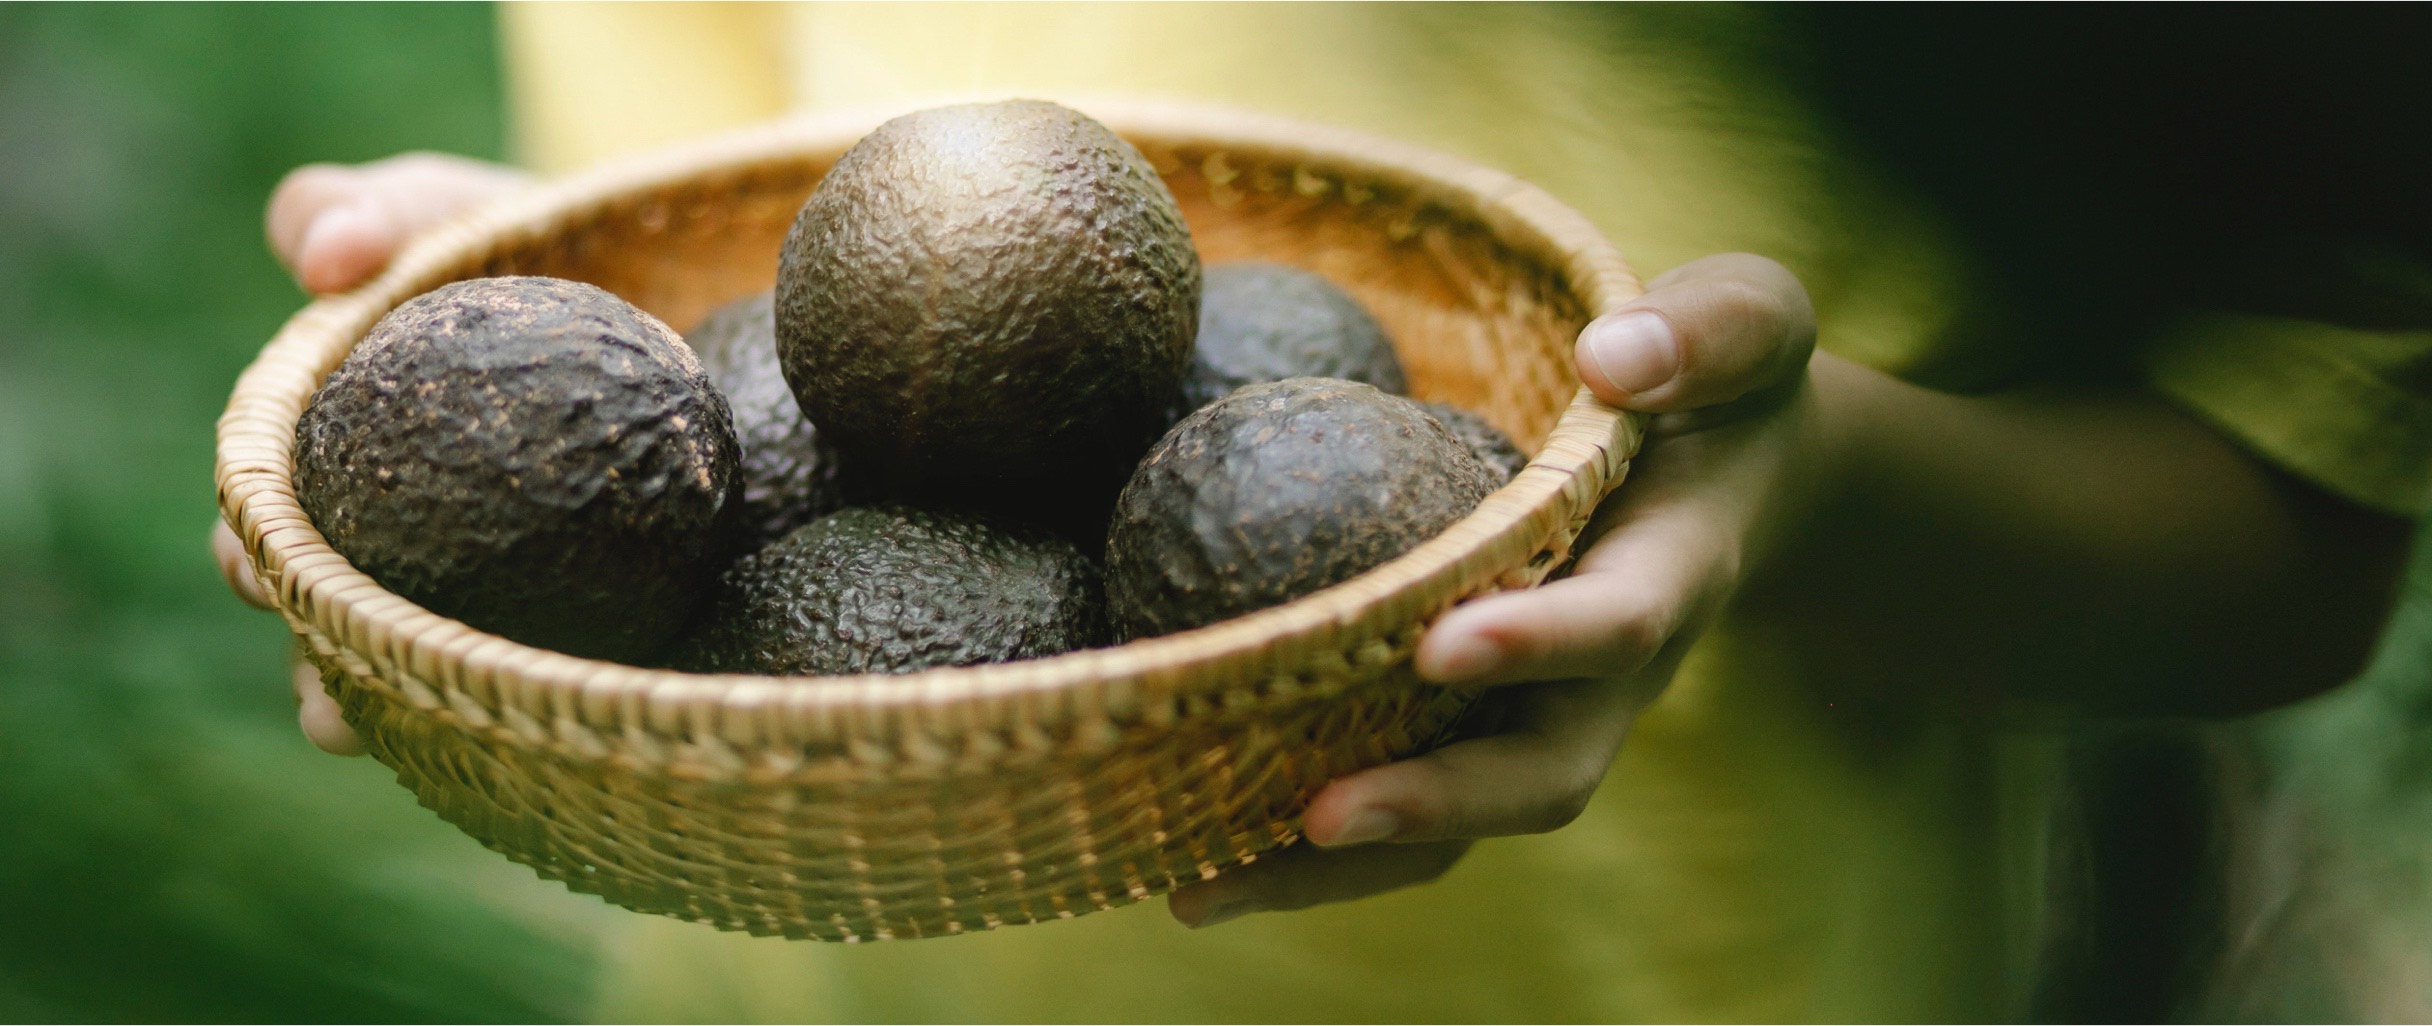
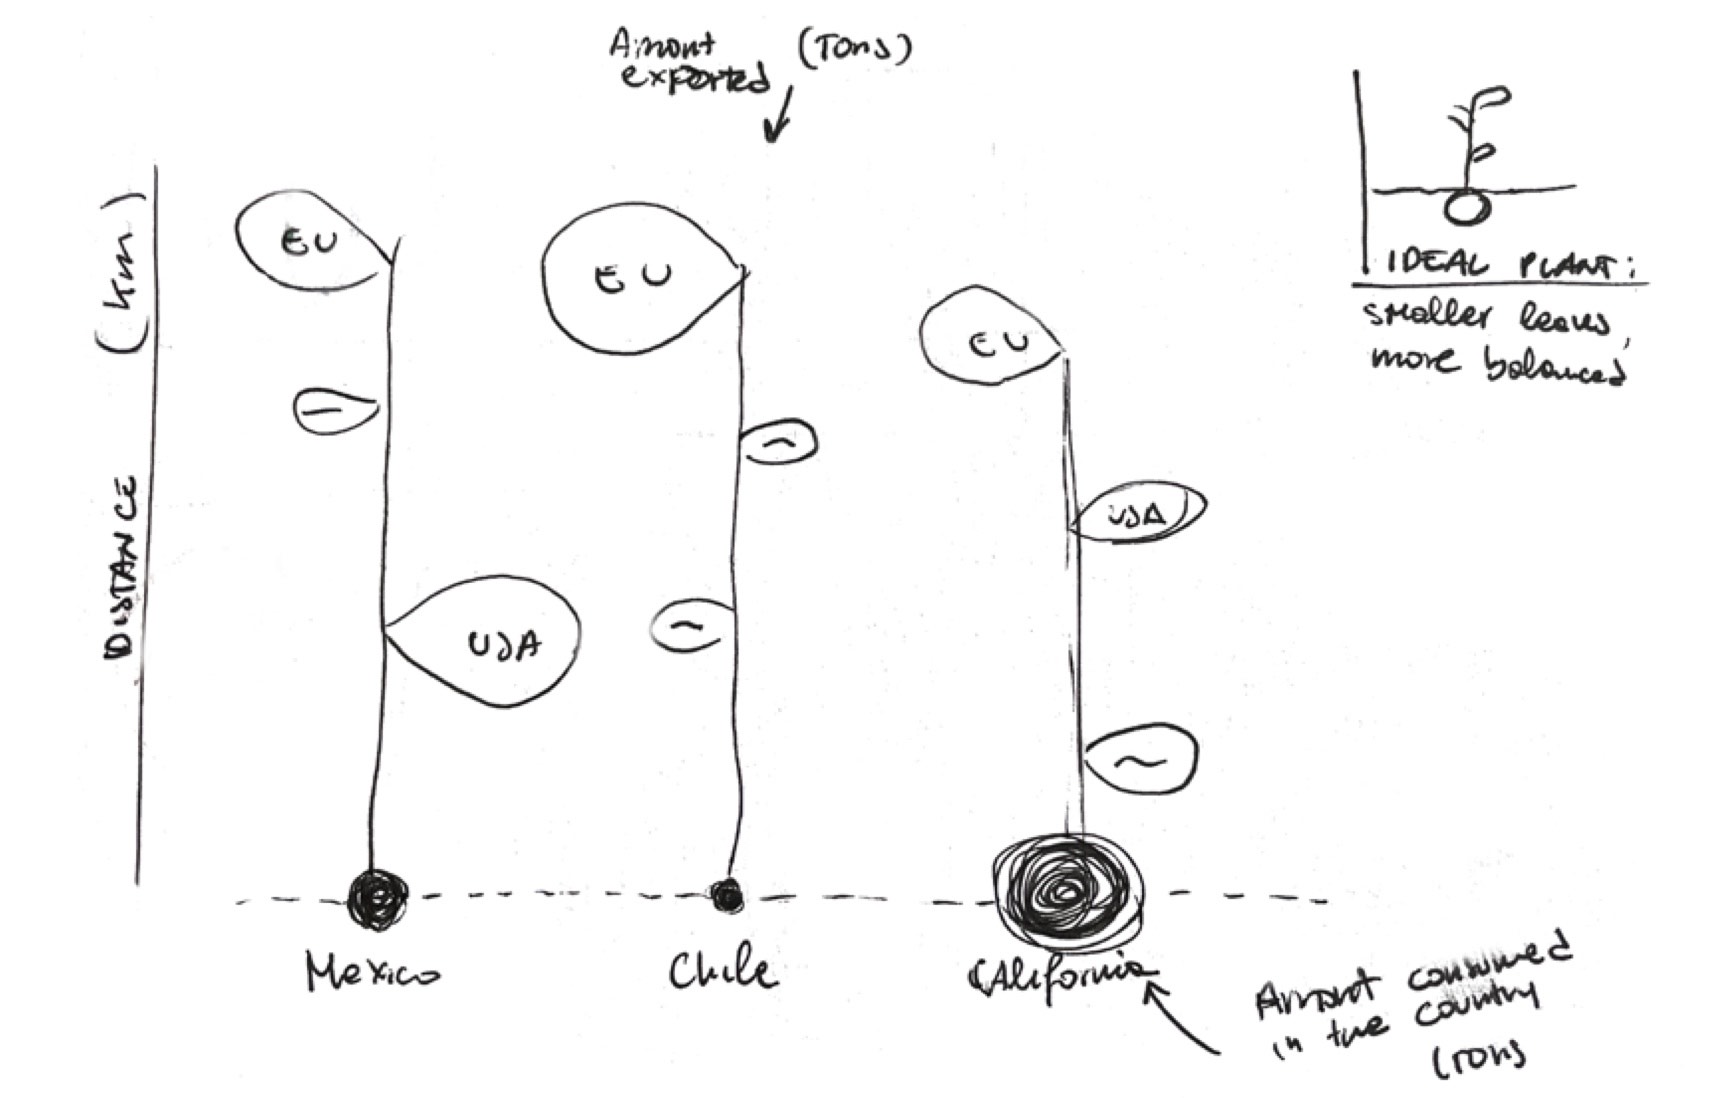
The team started its research on nature with a special interest in the migration of plants, starting from flowers moving to exotic fruits as they have the biggest traveling span around the world.
Studying and discussing the subject, it was decided to focus on the avocado trade, and the contraposition of the healthy and sustainable
lifestyle its consumption promotes among people with its actual negative impacts on the environment.
The research question came naturally after an initial phase of research and identification: “Is eating avocados for an healthy and sustainable lifestyle actually sustainable and healthy in the long period?"
Data Analysis
During the research phase, it was discovered that both avocado production and trade actually have multiple areas of concern: water depletion, deforestation, social unawareness, and cartel crime to mention a few. These areas not only relate to but also directly depend on one
another. Consequently, after collecting different datasets that paint a picture of these issues, the next step was to find ways to connect these datasets in meaningful ways, find common patterns and subsequently insights behind the numbers.

Sketches of
Visualization Ideas
After gathering all the data required, the team started brainstorming and sketching out ways on how the data collected could be shaped and what outcome could best emphasize its value and help spread knowledge.
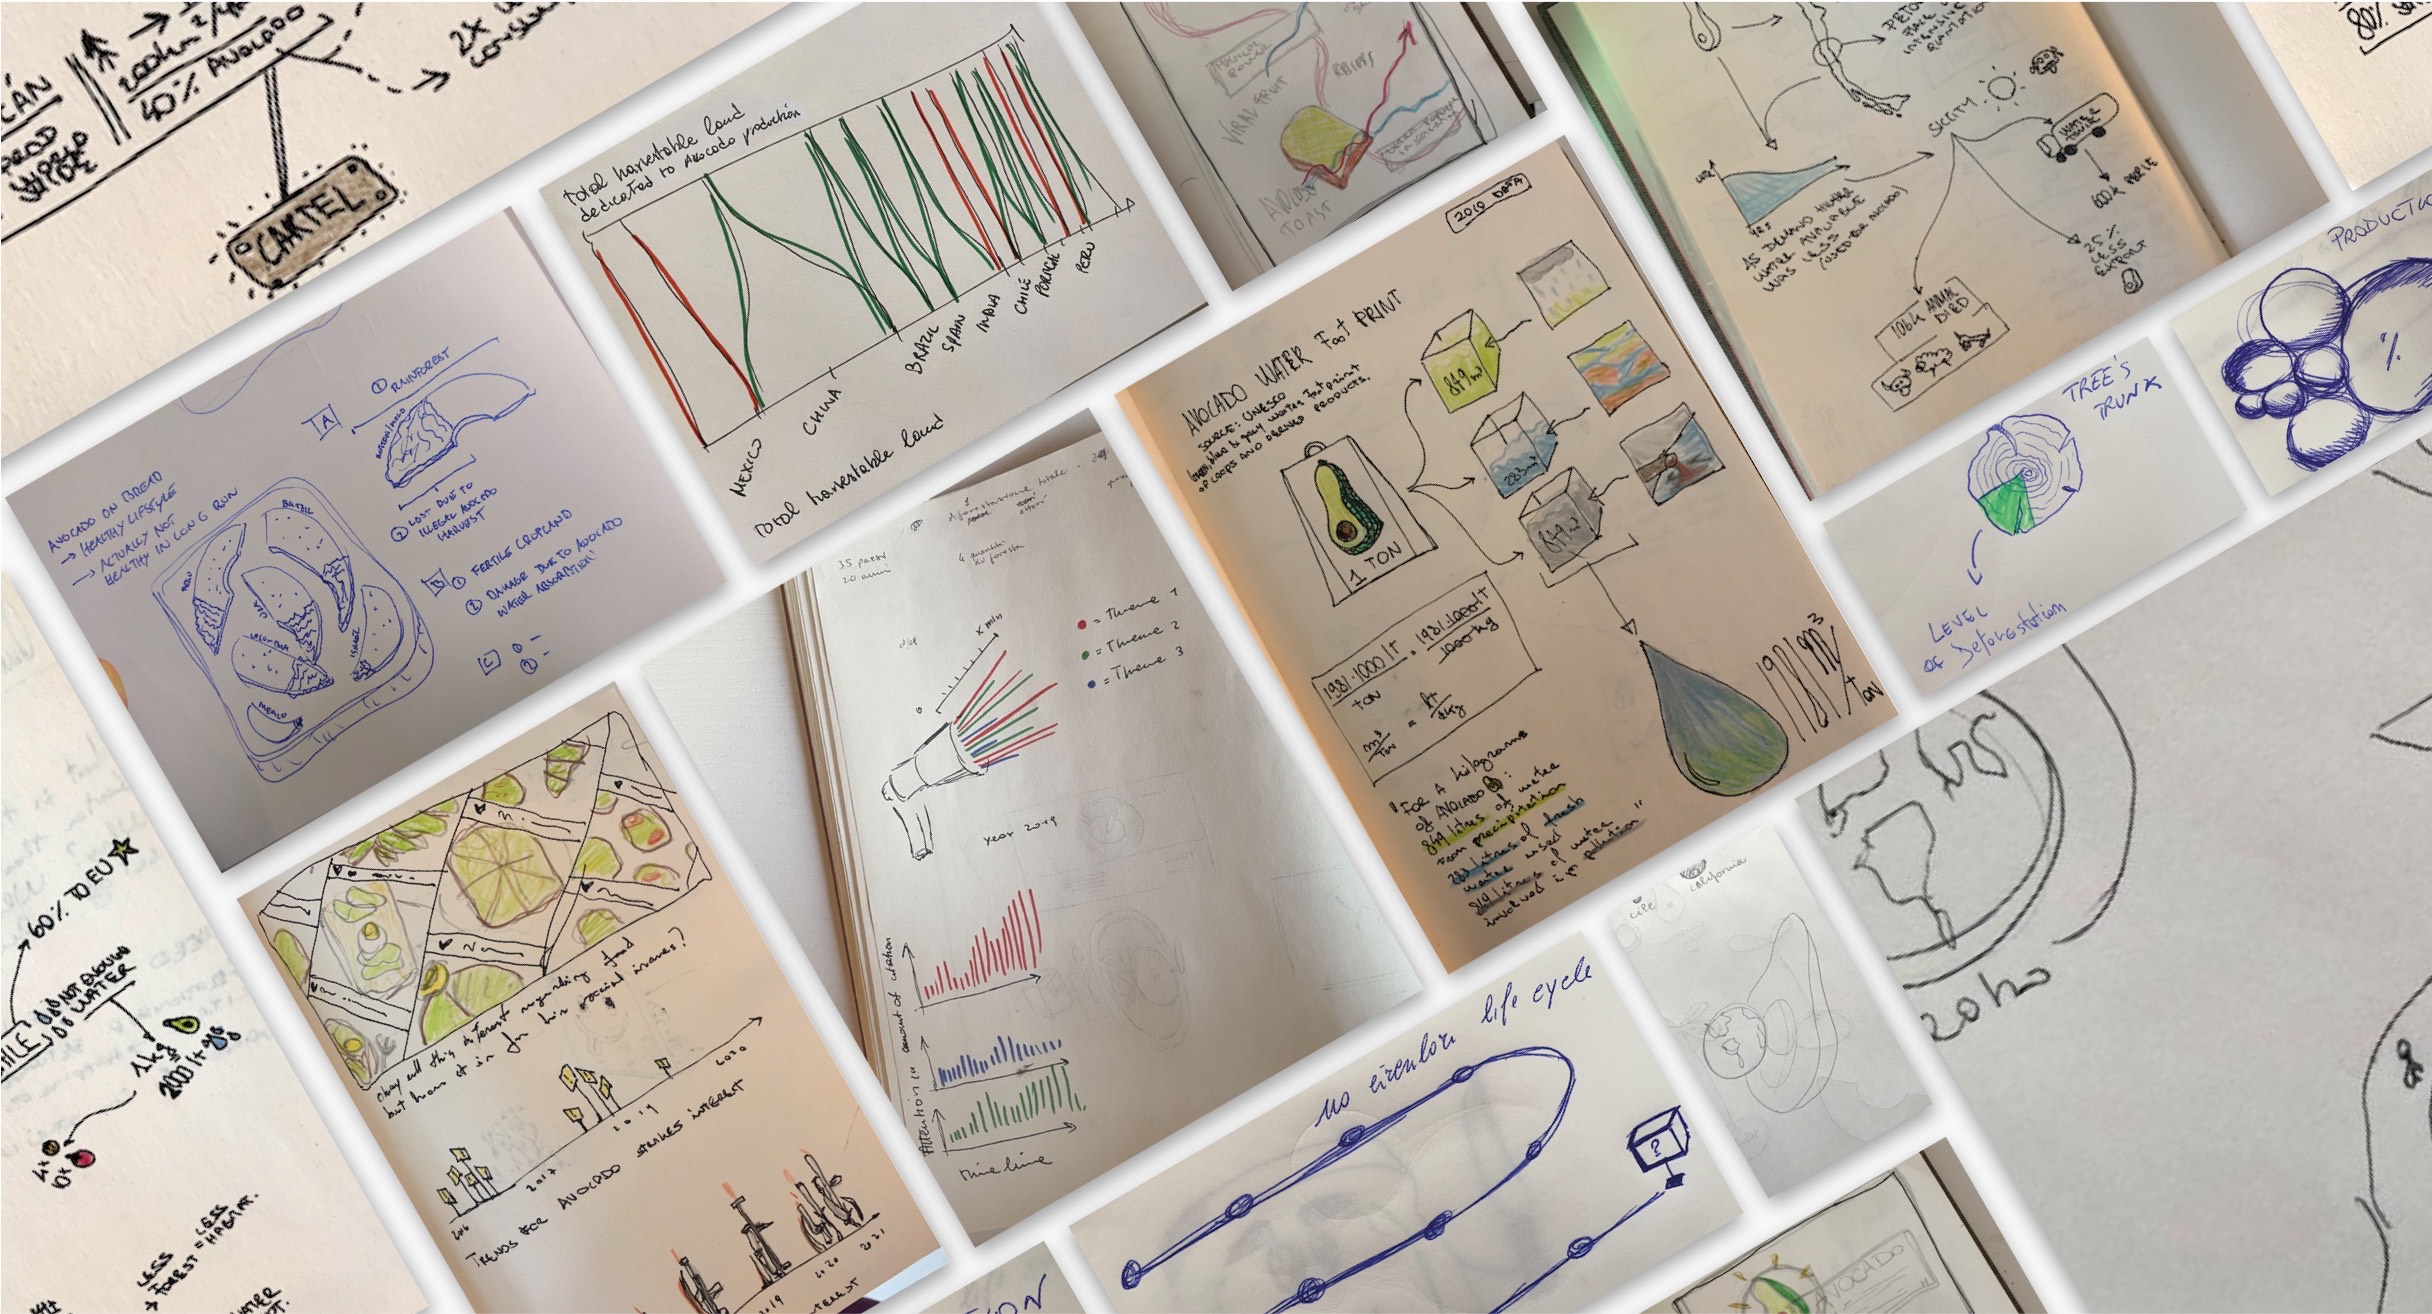
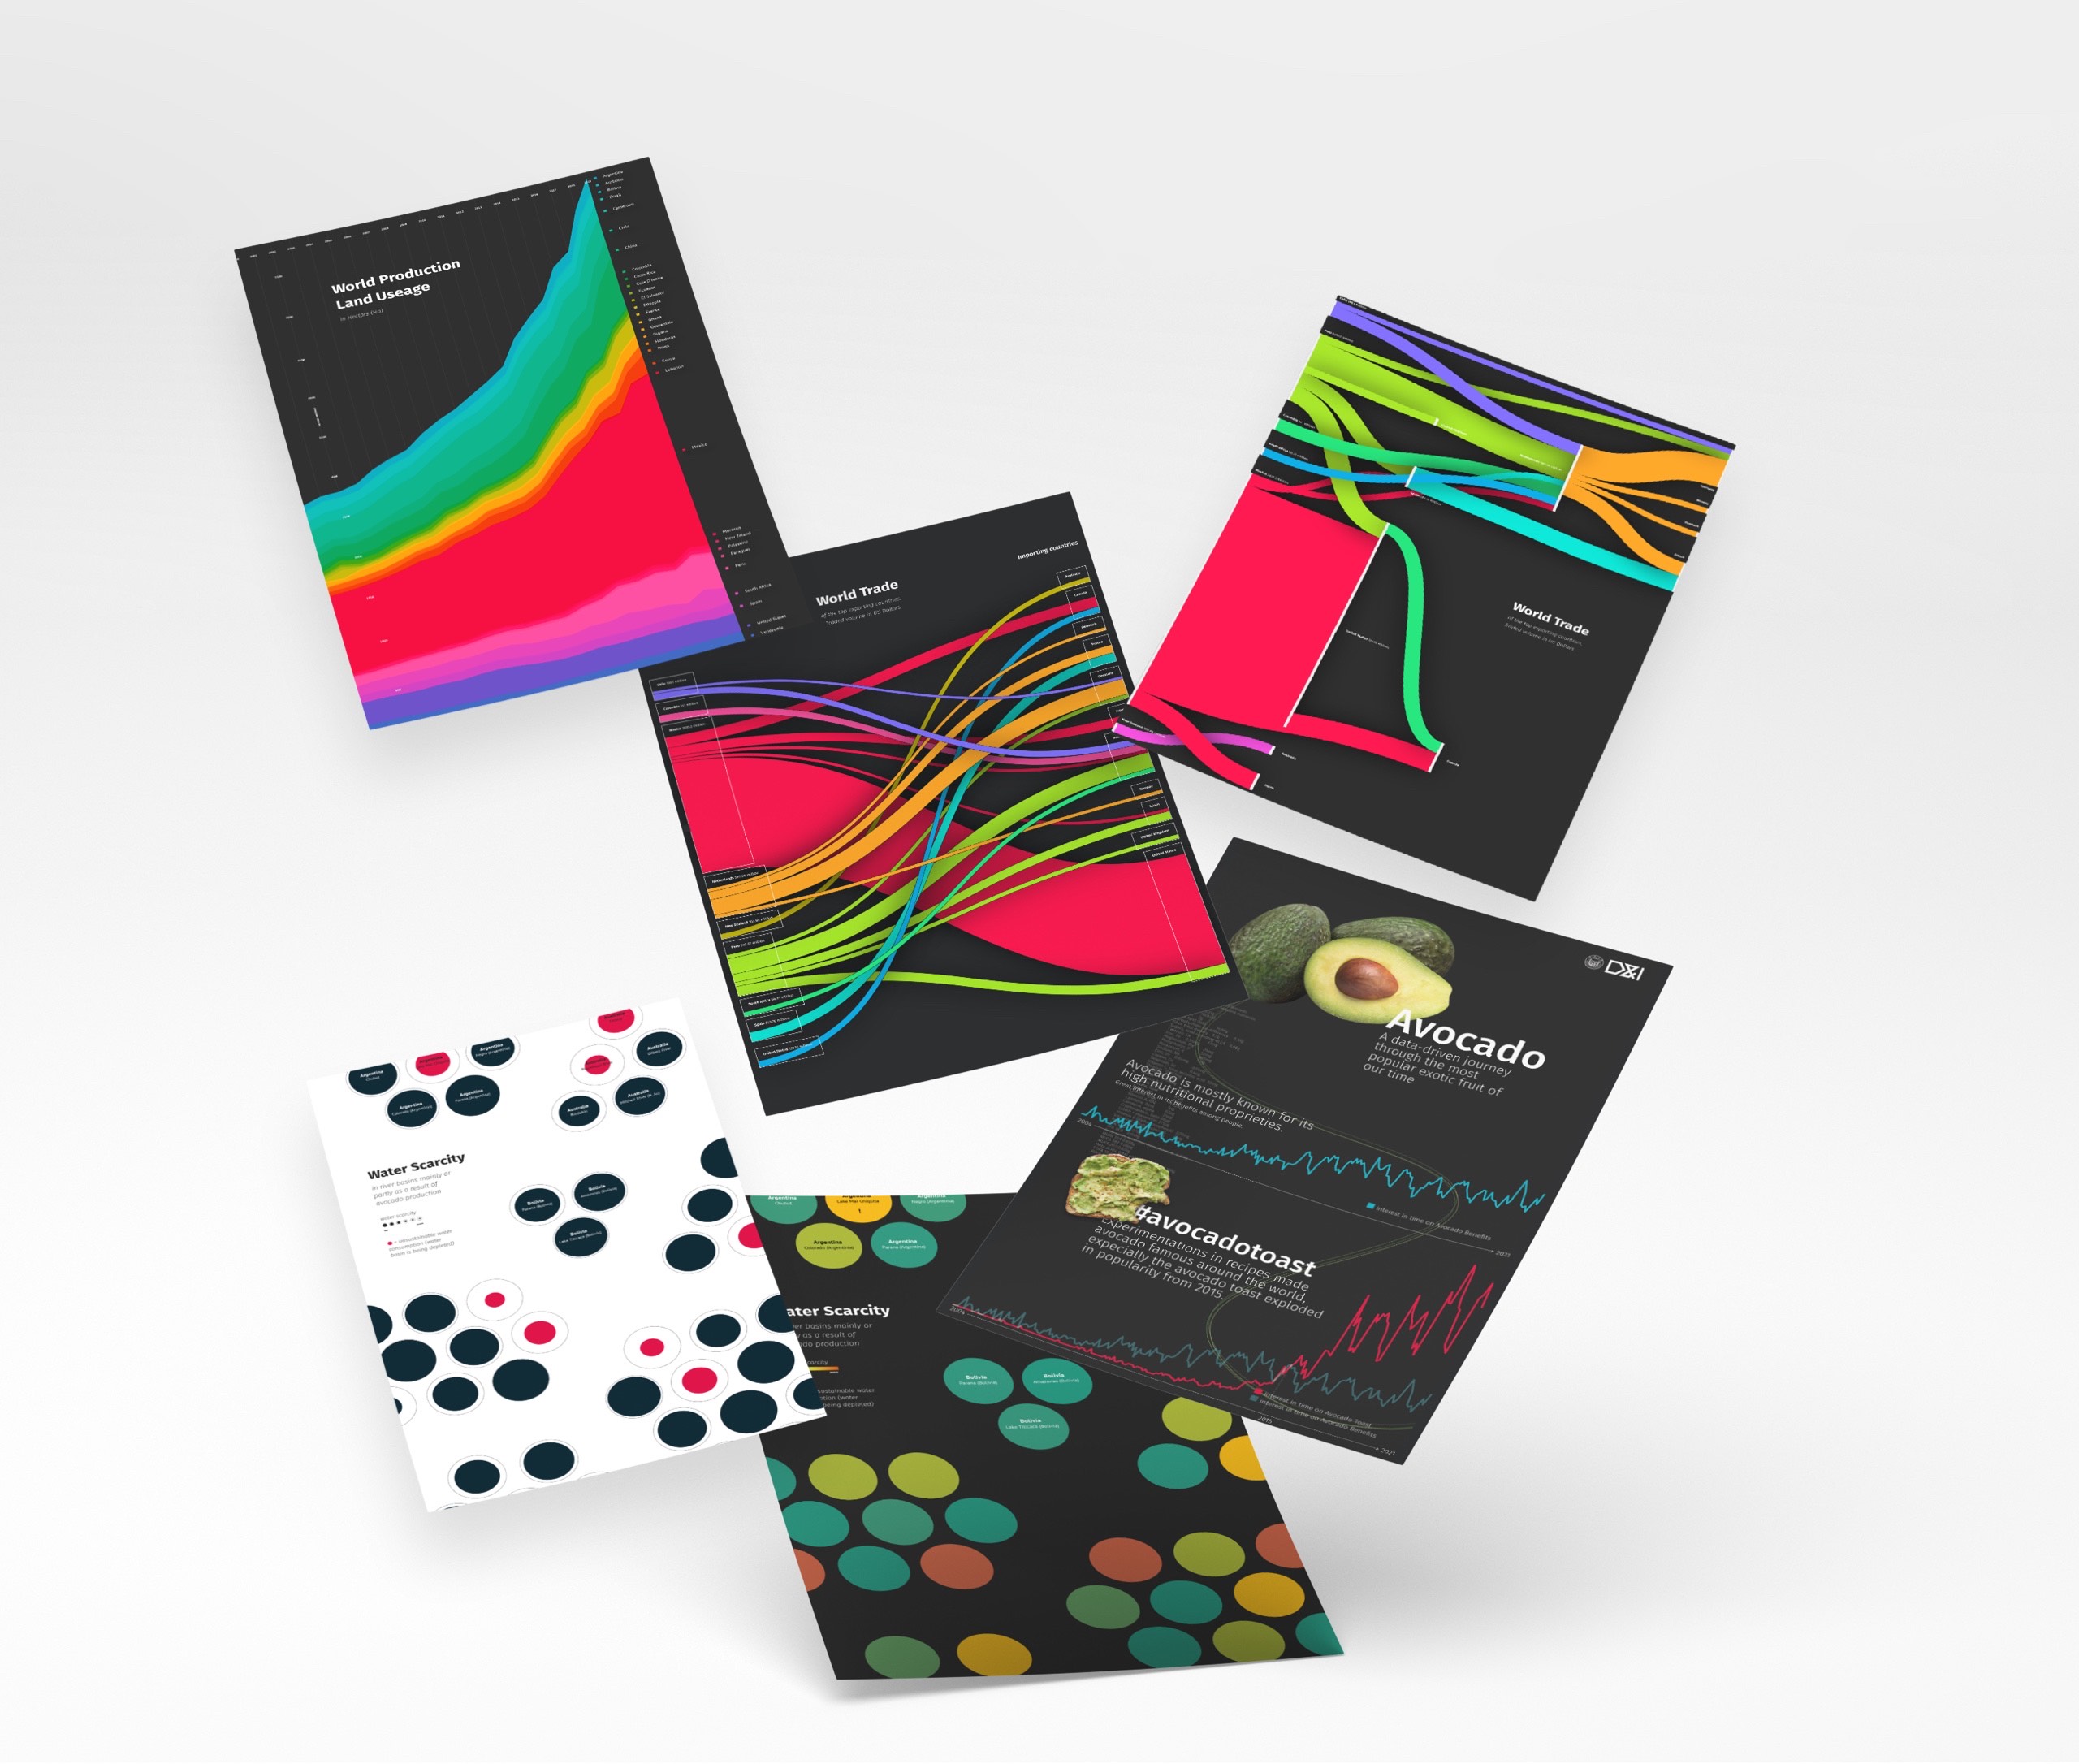
First Visualizations
First visualizations of some parts of the data were created, to start getting a feeling of its characteristics and patterns.
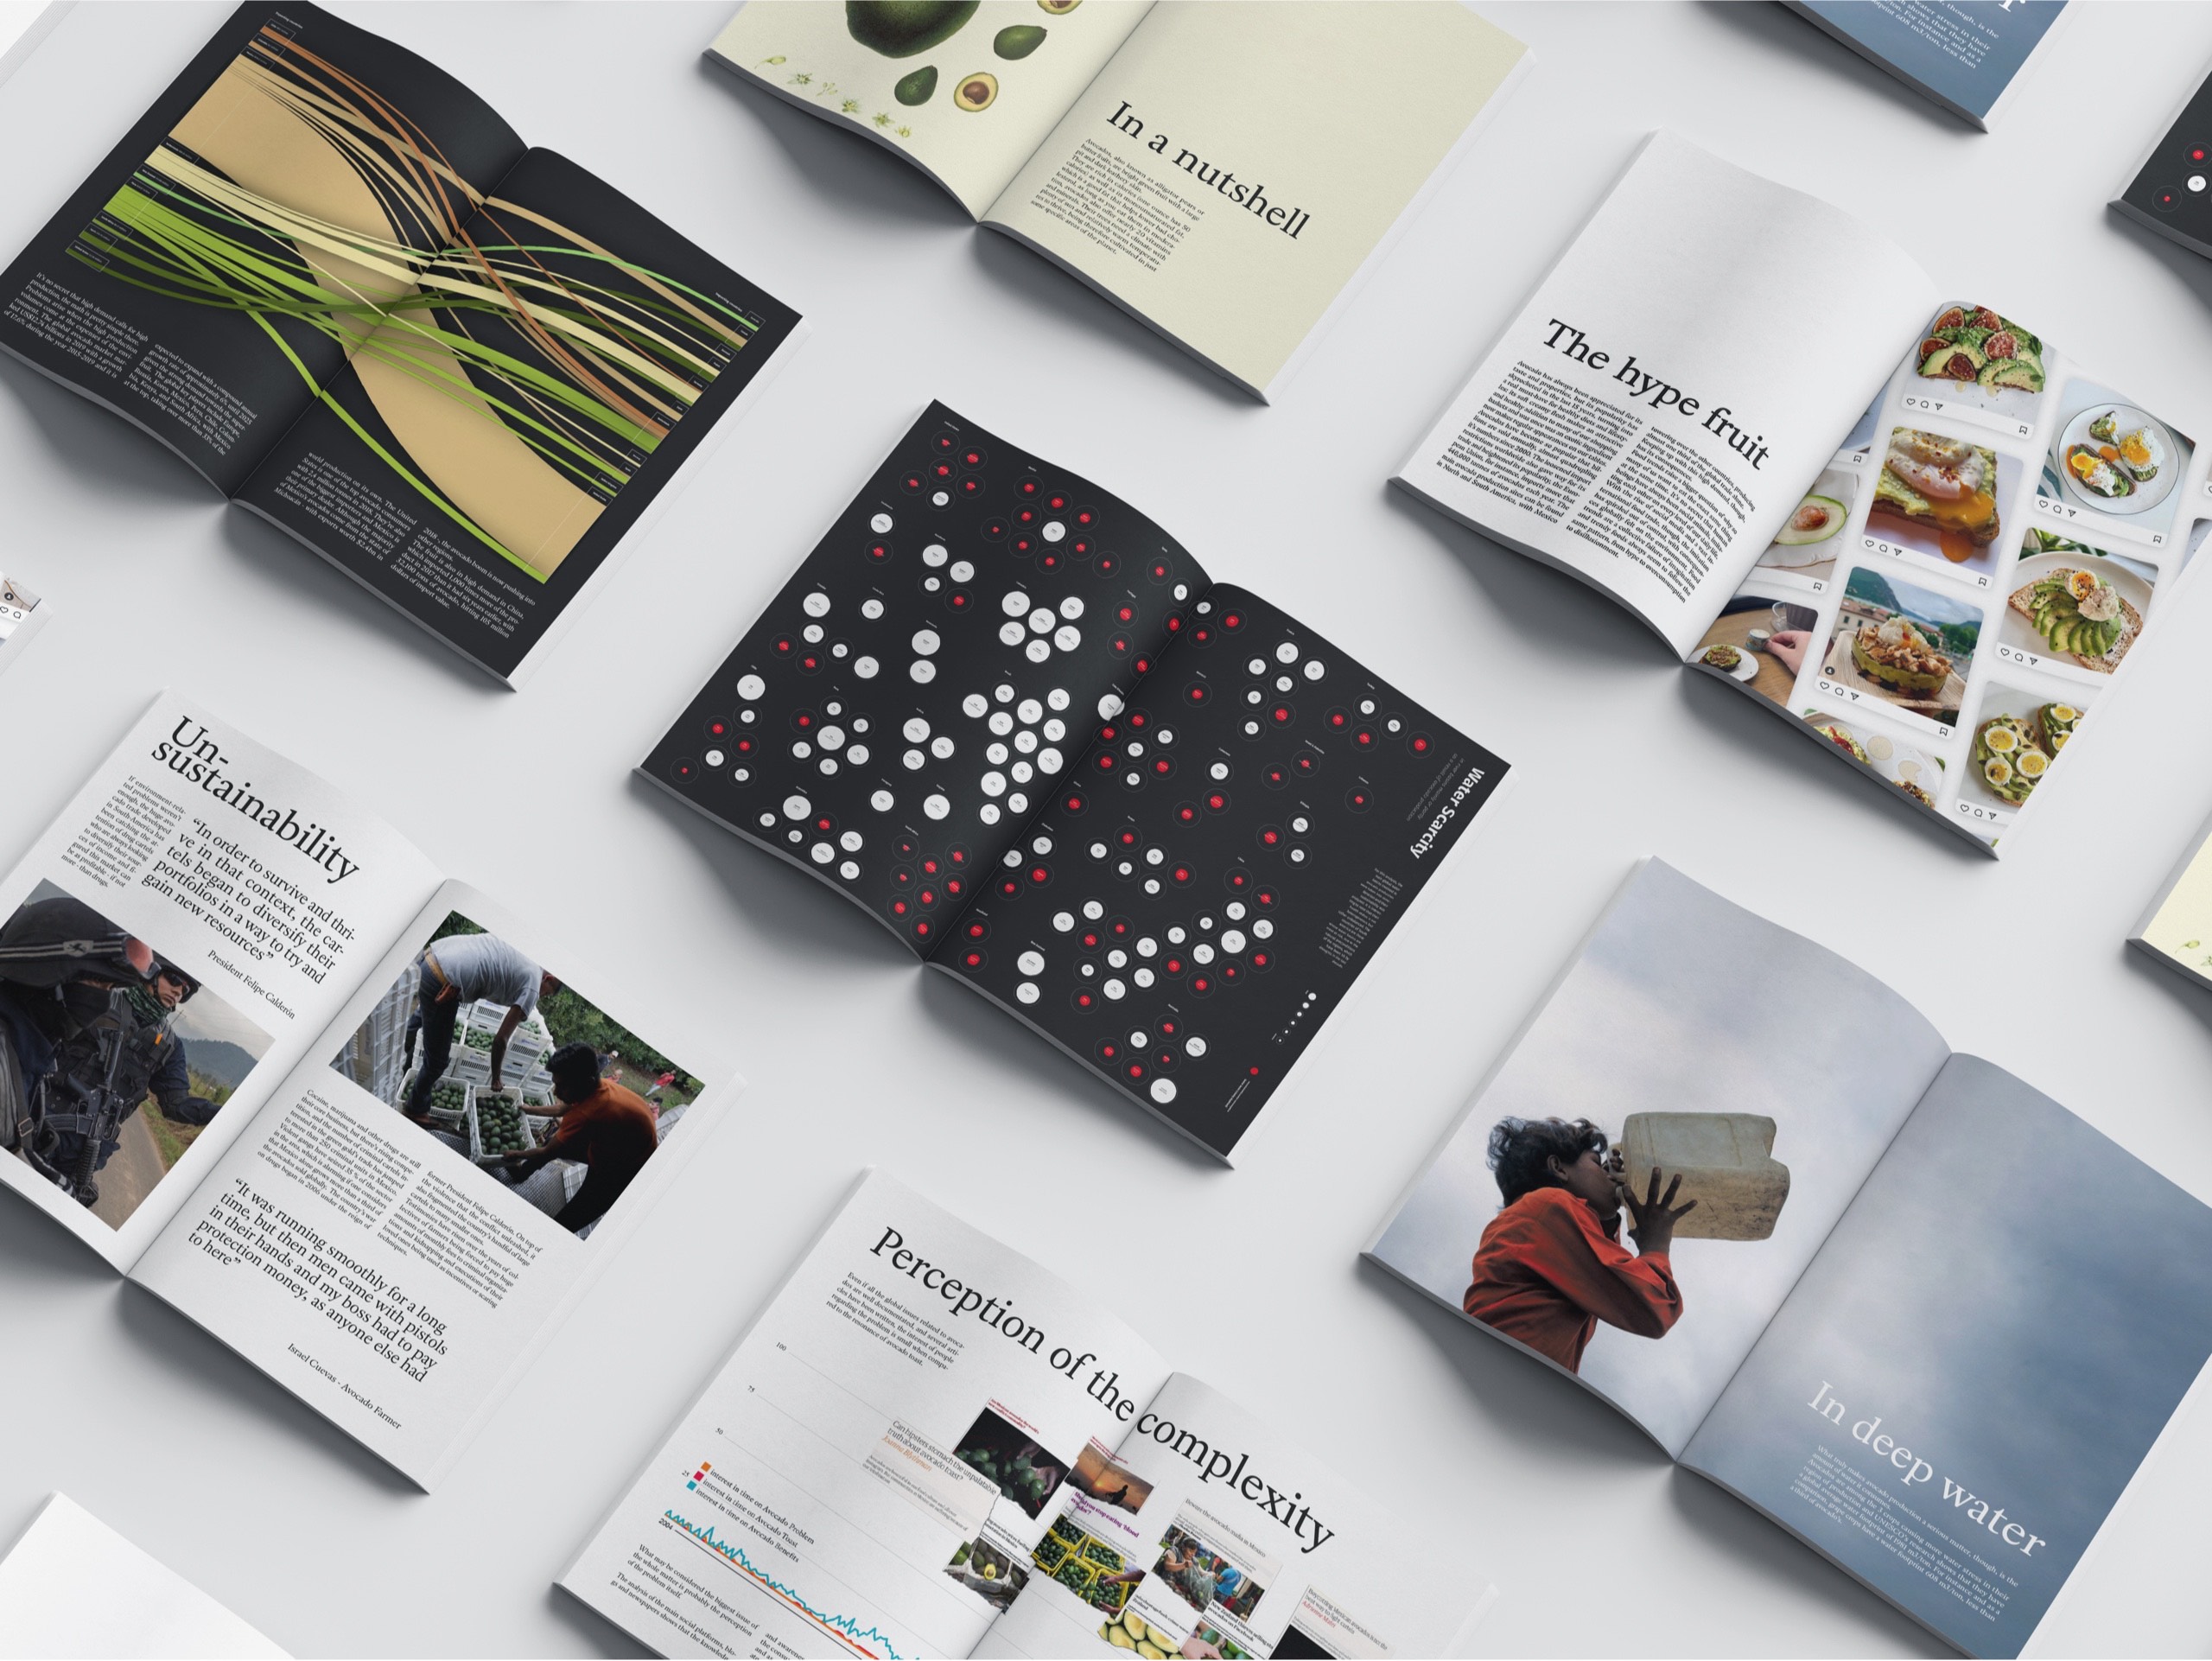
The lack of visibility regarding these issues was identified as the basis of the design project, thus bringing the team to develop a series of visualizations with the aim of shedding a light on the background dynamics of this theme.

Paper and Pixels
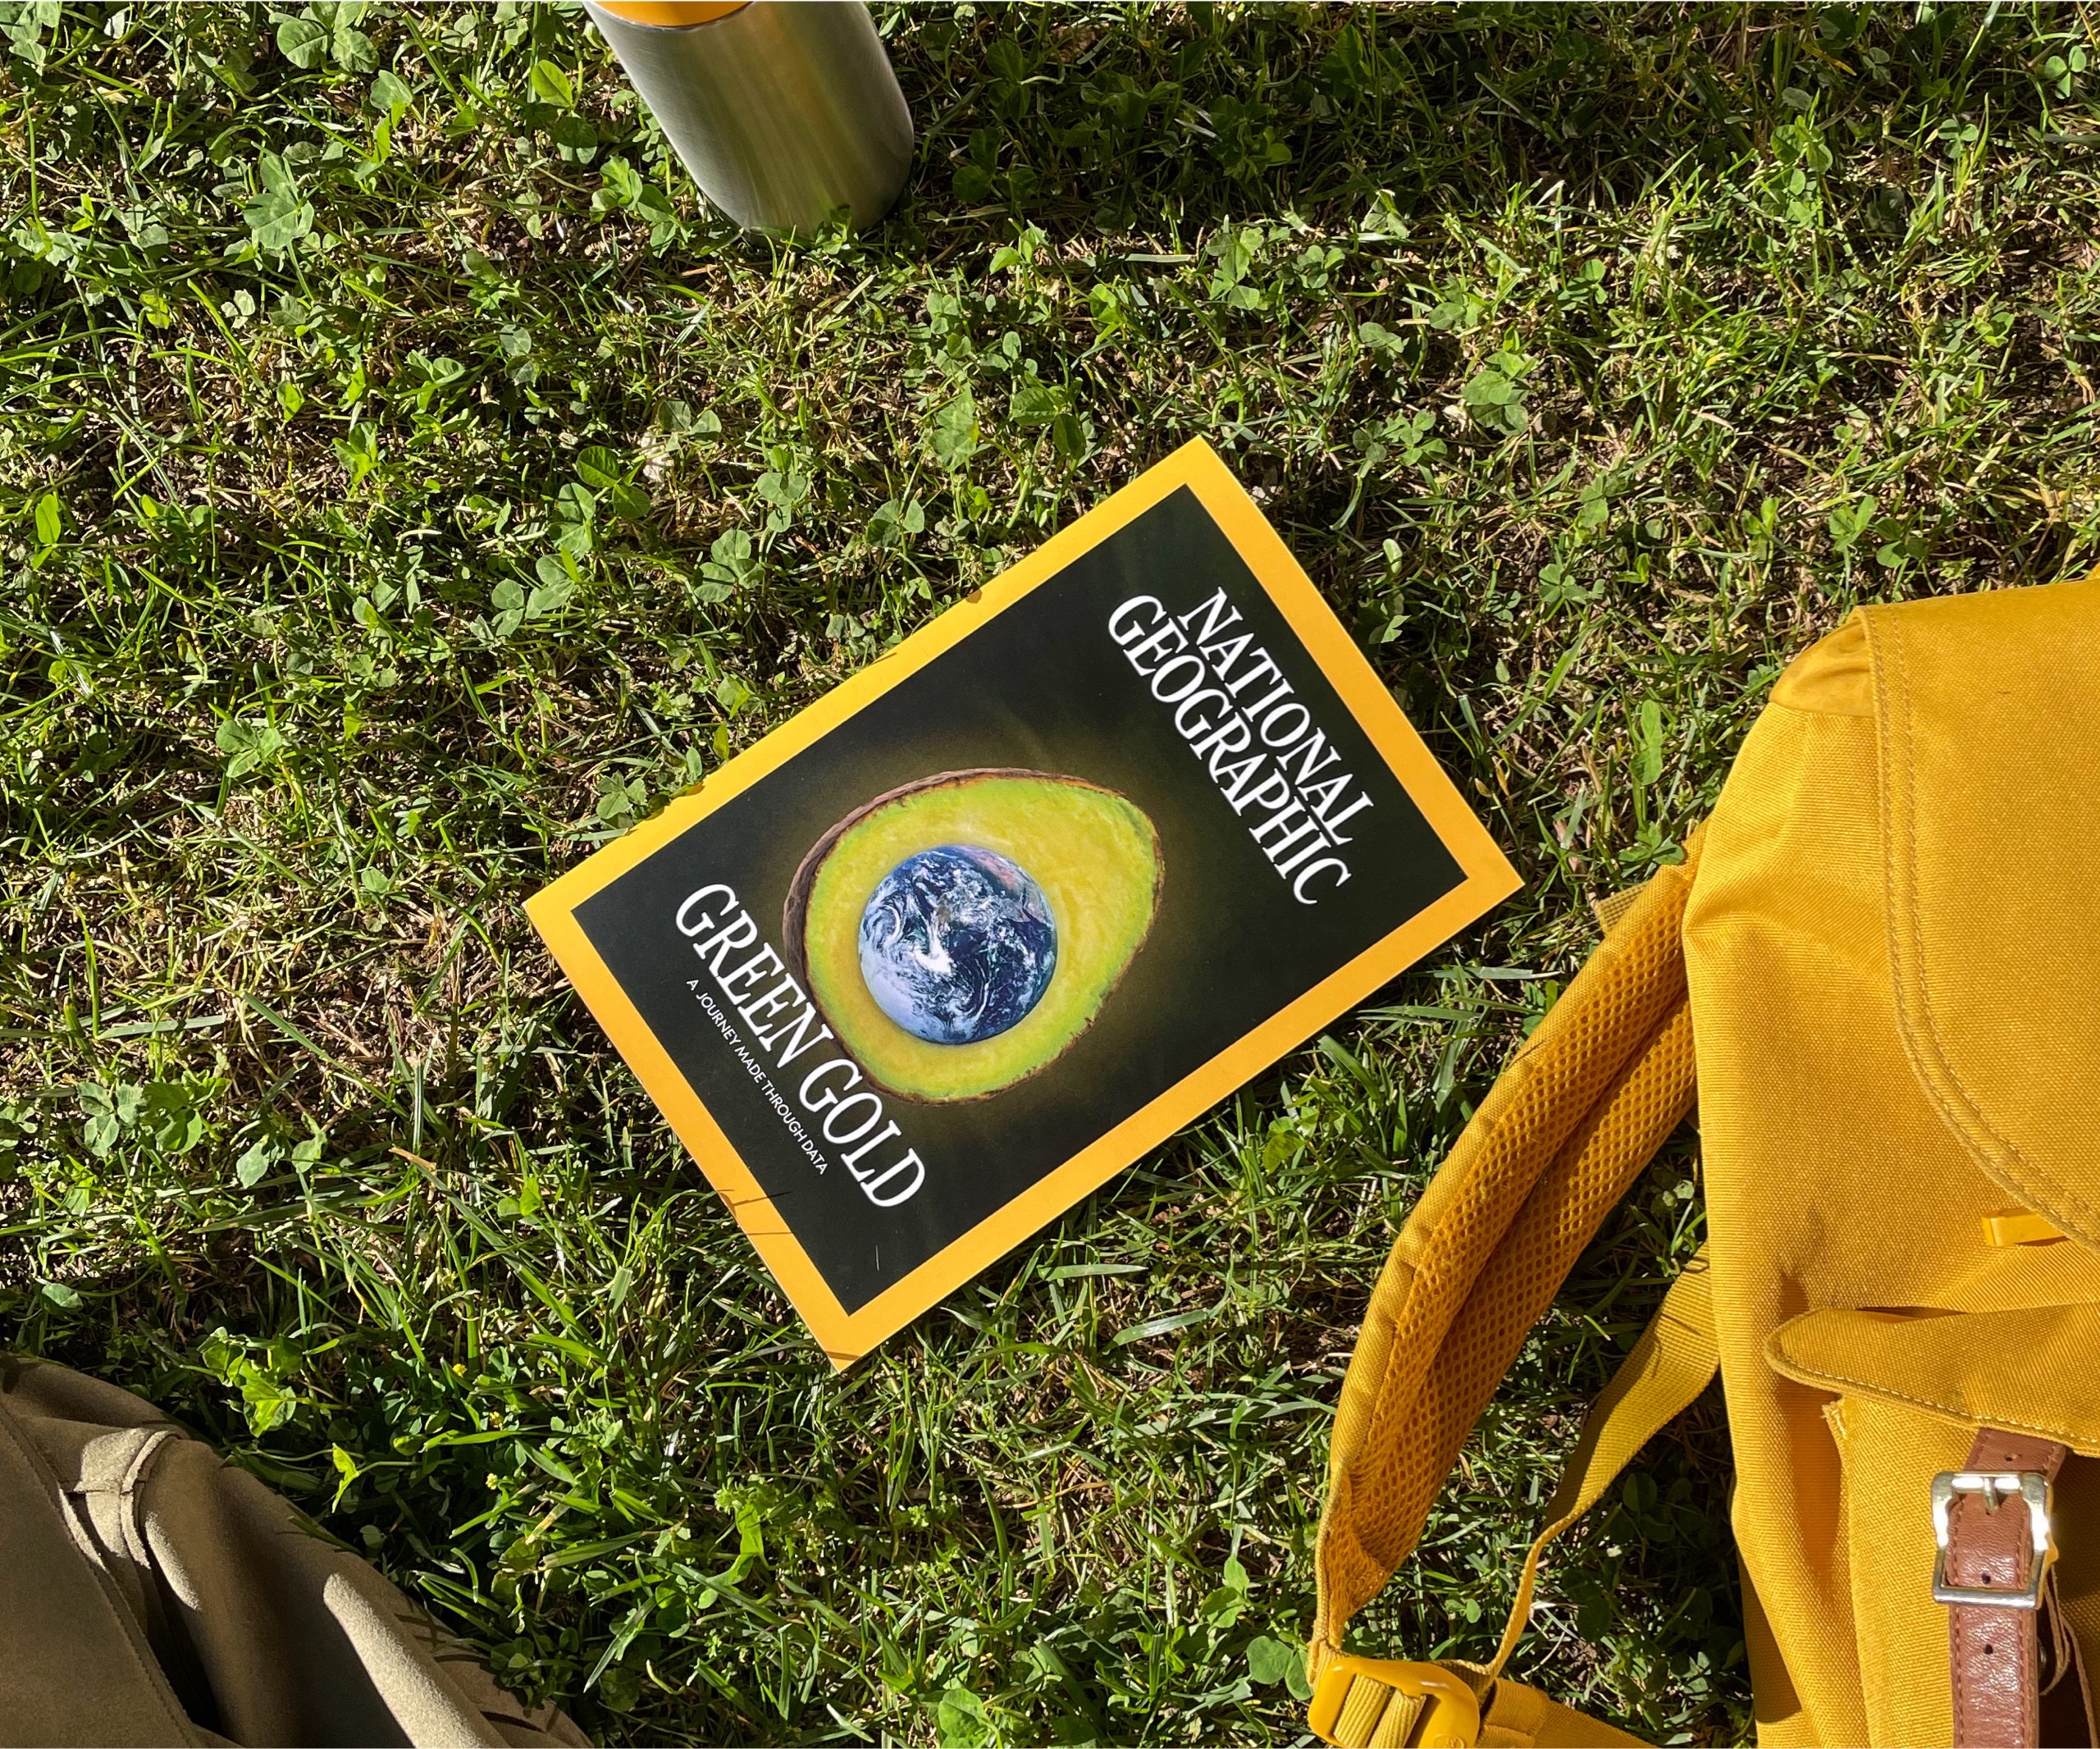
After few different proposals and ideas on how , we ended up developing the research it in the form of a magazine editorial, designed to result as a collaboration with magazines such as National Geographic or others with natural and social problems at heart. Even if our main efforts went to the
design of a printable magazine, a prototype of an digital version of the article was also developed. The digital editorial was not designed as a mere transcription of the text, but rather as an interactive experience that enhances the level of visualization of the graphics.

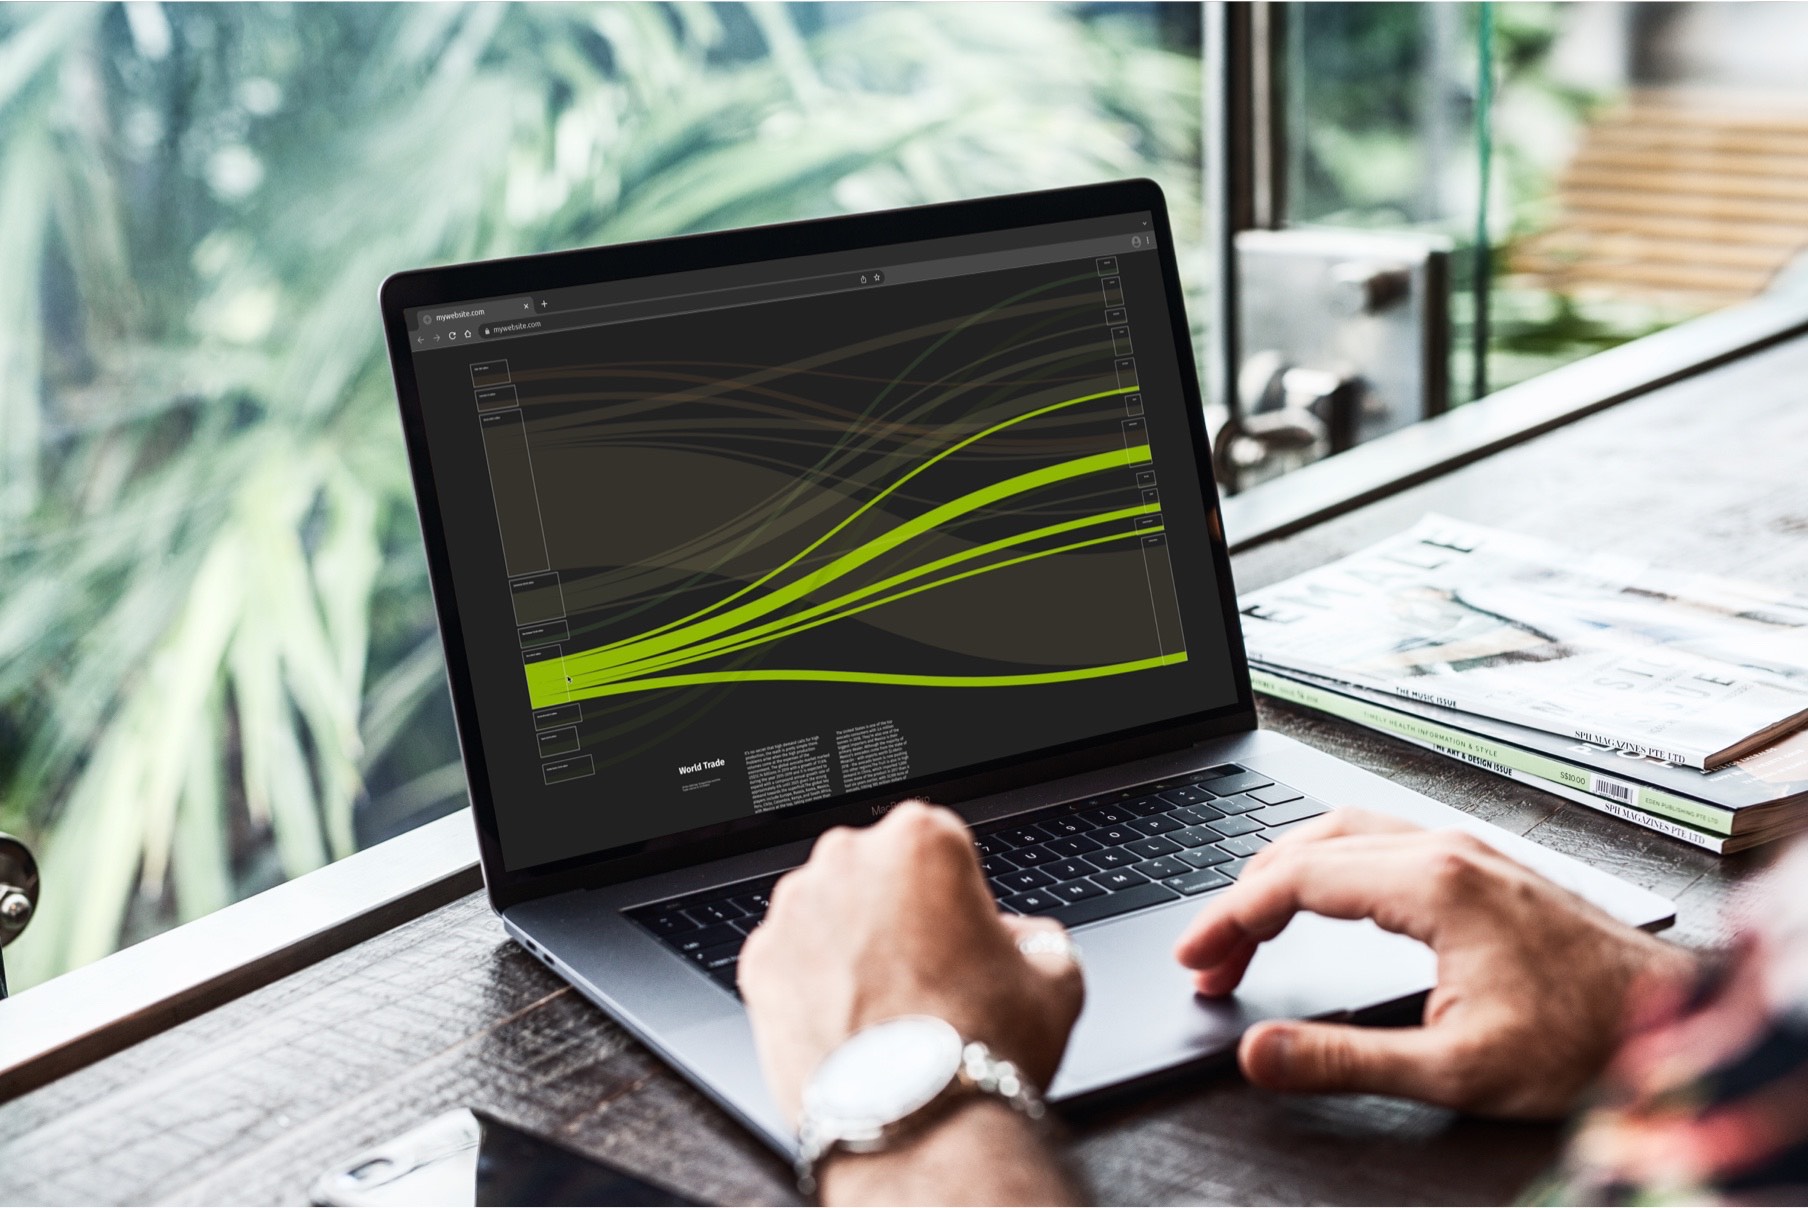
More Interactive
The interactive prototype features some more in depth information regarding different data points. Its interactions can implement the experience of those who choose to read the digital editorial instead of the printed version.